Introduction
CodeTracer is a user-friendly time-traveling debugger designed to support a wide range of programming languages.
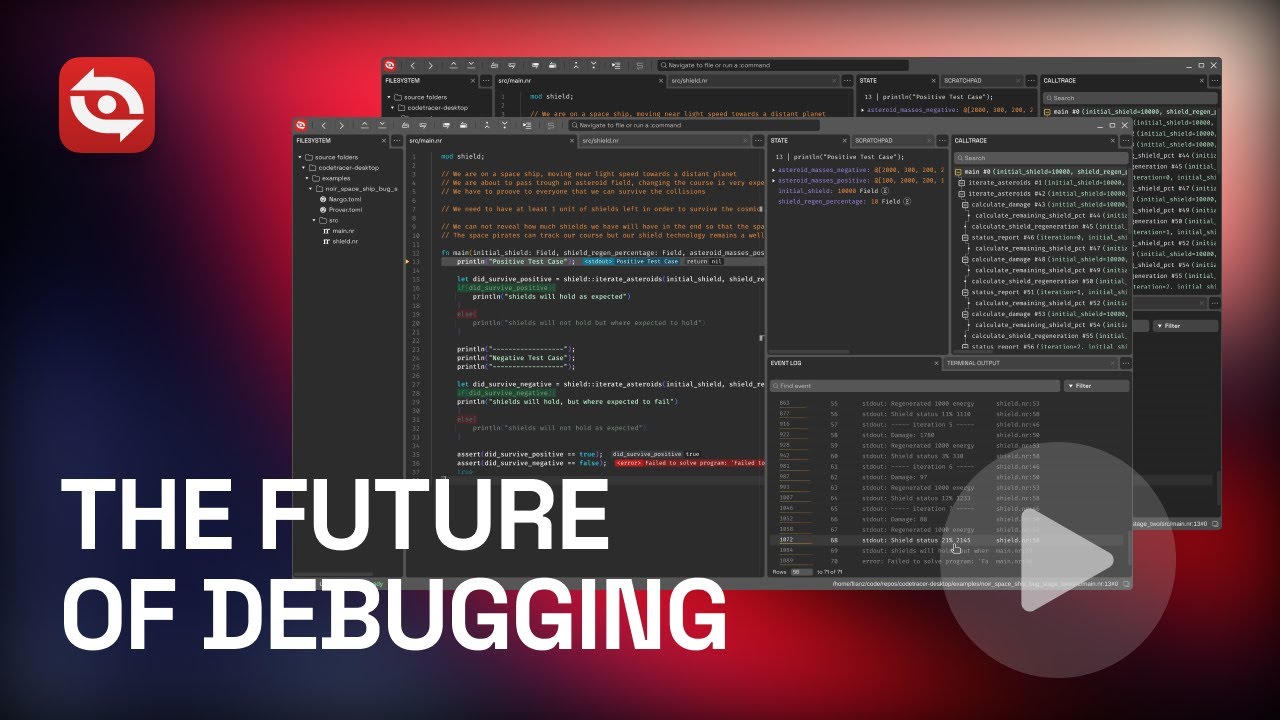
It records the execution of a program into a sharable self-contained trace file. You can load the produced trace files in a GUI environment that allows you to move forward and backward through the execution and to examine the history of all memory locations. They say a picture is worth a thousand words — well, a video is even better! Watch the demo below to see CodeTracer in action:
The benefits of time-travel
Compared to traditional debuggers, CodeTracer gives you two major superpowers:
-
Once you capture a bug in a recording, consider it squashed!
Bugs that are hard to reproduce can be painful to fix — you’ve surely been there. Once such a bug is captured with CodeTracer, you'll rarely need more than 30 minutes to track it down! This is largely a consequence of the next superpower:
-
Most bugs are easily revealed when you know the origin of any value in the program.
All programs produce output. Some examples are bytes generated as a response to a web request, pixels being drawn on your screen or perhaps a simple log line written to the terminal.
When CodeTracer creates a recording, it captures a user-extensible set of output events relevant to the program. The GUI displays these events in a searchable chronological event log.
Consider a misbehaving program that prints unexpected output to a log file midway through its execution. Clicking on the specific output event in CodeTracer will take you to the precise moment and code line where it was generated.
The unexpected value must be originating from some variable that's being passed to the logging function. With CodeTracer, you can now ask the question "Where did this value come from?". CodeTracer will find another moment in the execution, potentially multiple seconds earlier, in a completely different part of the program where this particular memory location was last written to.
This could be memory corruption or a genuine logical error. Either way, CodeTracer will report the origin. Let's say that you end up in the correct function that is responsible for computing the problematic value, but another input there leads to the issue. You can continue the search by repeating the question "Where did this input come from"? It usually takes just a few of these jumps to earlier moments in time to arrive at the root cause for the bug.
Every time you jump to a new moment in the execution, you can fearlessly explore your surroundings by stepping forward or backwards, having access to a back button that can always get you to any previous point of interest. At every point of the journey, our novel UI shows you details about the past and future program states at a glance and you know your position in the precisely recorded call trace of the program.
These features combined, make for a truly powerful debugging experience.