Introduction
CodeTracer is a user-friendly time-traveling debugger designed to support a wide range of programming languages.
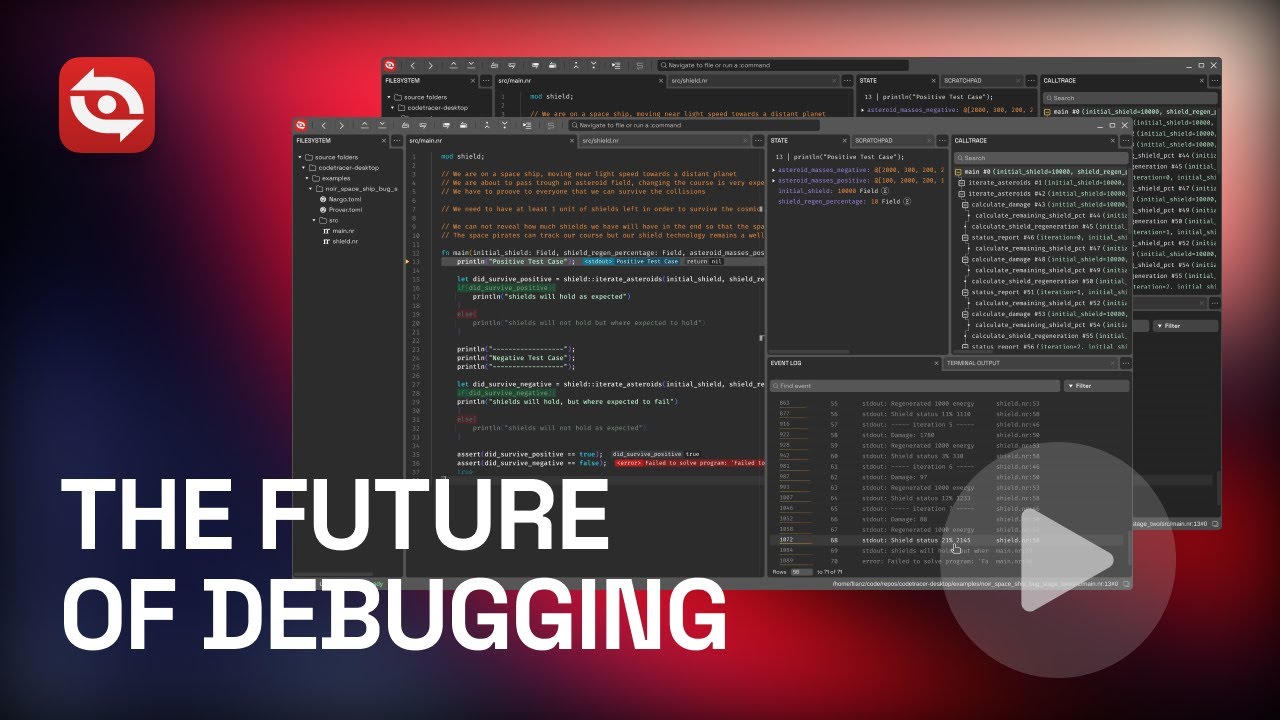
It records the execution of a program into a sharable self-contained trace file. You can load the produced trace files in a GUI environment that allows you to move forward and backward through the execution and to examine the history of all memory locations. They say a picture is worth a thousand words — well, a video is even better! Watch the demo below to see CodeTracer in action:
The benefits of time-travel
Compared to traditional debuggers, CodeTracer gives you two major superpowers:
-
Once you capture a bug in a recording, consider it squashed!
Bugs that are hard to reproduce can be painful to fix — you’ve surely been there. Once such a bug is captured with CodeTracer, you'll rarely need more than 30 minutes to track it down! This is largely a consequence of the next superpower:
-
Most bugs are easily revealed when you know the origin of any value in the program.
All programs produce output. Some examples are bytes generated as a response to a web request, pixels being drawn on your screen or perhaps a simple log line written to the terminal.
When CodeTracer creates a recording, it captures a user-extensible set of output events relevant to the program. The GUI displays these events in a searchable chronological event log.
Consider a misbehaving program that prints unexpected output to a log file midway through its execution. Clicking on the specific output event in CodeTracer will take you to the precise moment and code line where it was generated.
The unexpected value must be originating from some variable that's being passed to the logging function. With CodeTracer, you can now ask the question "Where did this value come from?". CodeTracer will find another moment in the execution, potentially multiple seconds earlier, in a completely different part of the program where this particular memory location was last written to.
This could be memory corruption or a genuine logical error. Either way, CodeTracer will report the origin. Let's say that you end up in the correct function that is responsible for computing the problematic value, but another input there leads to the issue. You can continue the search by repeating the question "Where did this input come from"? It usually takes just a few of these jumps to earlier moments in time to arrive at the root cause for the bug.
Every time you jump to a new moment in the execution, you can fearlessly explore your surroundings by stepping forward or backwards, having access to a back button that can always get you to any previous point of interest. At every point of the journey, our novel UI shows you details about the past and future program states at a glance and you know your position in the precisely recorded call trace of the program.
These features combined, make for a truly powerful debugging experience.
Installation
caution
CodeTracer can only be installed on Linux and macOS currently.
Download binaries
Recommended: automatically
We provide a automatic installer that installs CodeTracer in the best possible way for your current system. You can run it by running the following in a terminal:
user $ curl "https://downloads.codetracer.com/install.sh" | sh
caution
On macOS it's recommended that you install homebrew beforehand. This is because the installer tries to install ruby from homebrew to enable our ruby recording features. Make sure you install homebrew in order to not lose this feature.
Manually on Linux
Here is a list of our Linux packages:


![]()
![]()
![]()
![]()
![]()
tip
You can place the downloaded app in a location of your choosing (e.g. ~/.local/bin)
Manually on macOS
You can download a .dmg app bundle from our website:
![]()
tip
You can place the downloaded app in a location of your choosing (e.g., the Applications folder on macOS).
When you launch CodeTracer for the first time, it will prompt you to complete the remaining installation steps, such as adding the command-line utilities to your PATH.
caution
Upon the first launch, macOS users will see the error message "CodeTracer is damaged and can't be opened". To resolve this problem, please execute the command xattr -c <path/to/CodeTracer.app>.
We expect this inconvenience will be remedied soon through our enrollment in the Apple Developer program that will ensure CodeTracer is properly signed and whitelisted by Apple. See this discussion for more details.
caution
Recording ruby on macOS requires you to install ruby through homebrew, otherwise trying to record ruby programs will fail due to the built-in ruby binary on macOS being more than 7 years old.
Once homebrew is installed, simply install ruby with user $ brew install ruby.
note
Python recordings reuse whichever interpreter resolves when you run python (or python3) in your shell. Install the codetracer_python_recorder package in that environment (for example pip install codetracer_python_recorder) before running ct record my_script.py. You can point CodeTracer at a specific interpreter by setting CODETRACER_PYTHON_INTERPRETER. See the Python getting-started guide for a full walkthrough covering installation, recording, and replay.
Installation from source
Linux (and other Nix-based systems)
Prerequisites
On systems that are not NixOS, you need to install direnv and nix.
Nix should not be installed through your distribution's package manager, but from here.
Direnv should be set up in your shell, as shown here.
Building from source
- Clone the repository with submodules:
git clone https://github.com/metacraft-labs/codetracer.git --recursive - Enter the created directory
- Add the following text to
~/.config/nix/nix.confif it doesn't already exist:experimental-features = nix-command flakes - Run
nix develop - Run
direnv allow - To build codetracer simply run
just build. The location of the resulting binary will be./src/build-debug/bin/ct - Now every time you enter the
codetracerdirectory your environment should be updated
tip
Users of Visual Studio Code might encounter issues when using code .. To fix them do the following:
- Run
direnv deny - Run
code . - Run
direnv allow
macOS
Prerequisites
The only dependencies for the macOS build are git, bash and homebrew.
Building from source
- Clone the repository with submodules:
git clone https://github.com/metacraft-labs/codetracer.git --recursive - Enter the created directory
- Run
./non-nix-build/build.shfrom the root of the cloned repository. This will install all prerequisites like Rust, Nim and others using homebrew - The resulting binary can be found at
./non-nix-build/CodeTracer.app/Contents/MacOS/bin/ct, and a DMG installer is created at./non-nix-build/CodeTracer.dmg.
Building and running the tests
Currently, you can run the db-backend (Rust) tests:
# inside src/db-backend:
cargo test --release --bin db-backend # test most cases: non-ignored
cargo test --release --bin db-backend -- --ignored # test the ignored cases: ignored by default as they're slower
some initial simple end to end playwright tests:
just test-e2e
Overview
Welcome to the CodeTracer's getting started section. This guide will help you understand how to record and replay programs in each of the supported programming languages.
Core Concept: Record and Replay
Unlike traditional debuggers that attach to a running process, CodeTracer works by first recording your application's execution into a trace file. This trace captures everything that happens during the run.
Once a recording is made, you can replay it as many times as you need in the CodeTracer GUI. This allows you to inspect the application's state at any point in time, move forwards and backwards through the execution, and use powerful features like tracepoints without having to run your application again.
Think of it like recording a video of your program's execution that you can then analyze in detail.
How to Use This Guide
This guide is structured to help you get started quickly and then dive deeper into the features that interest you.
- Instructions on how to launch CodeTracer using each of the languages listed below
- Noir: Examples and steps how to trace a Noir program.
- Stylus: Examples and steps how to trace a Stylus.
- Python: Steps for installing the recorder, creating a trace, and replaying it with your interpreter.
- Ruby: Examples and steps how to trace a Ruby program.
- WASM: Examples and steps how to trace a WASM program.
Noir
The initial release of CodeTracer has MVP support for the Noir programming language. It has been developed in collaboration with the Blocksense team and currently requires the use of the Blocksense Noir Compiler, which is included in the CodeTracer distribution.
We support many of Noir's features, but not all: e.g. we don't support mutable references currently, we don't serialize struct values and some other cases.
We are planning on adding support for the missing features in the future.
How to Trace a Noir Program
Before tracing your Noir program, you must compile it and provide the inputs. CodeTracer expects your project to have a Prover.toml file containing the inputs for your program.
- Navigate to your Noir project's directory.
- Generate a
Prover.tomlfile:nargo check - Edit the necessary inputs in your
Prover.tomlfile.
Once your project is ready, you can use CodeTracer's commands from the CodeTracer directory.
Running a Program (ct run)
This command executes your Noir program and displays the visual trace in the CodeTracer UI. This is the most direct way to see your code's execution.
To run the noir_space_ship example included with CodeTracer:
# Make sure you are in the root CodeTracer directory
ct run examples/noir_space_ship
Recording a Trace (ct record)
This command runs your program and saves its execution trace.
ct record examples/noir_space_ship
Replaying a Trace (ct replay)
This command loads a previously recorded trace and displays it in the CodeTracer UI.
# First, record a trace if you haven't already
ct record examples/noir_space_ship

# Then, replay it
ct replay
You will be asked to choose which trace to replay from a list of recent traces.
Getting Started with Stylus
This guide will walk you through tracing an Arbitrum Stylus smart contract with CodeTracer. The process involves deploying a contract and then sending transactions to it, which CodeTracer will automatically record.
The implementation is based on a wazero WASM interpreter and has been tested with Stylus contracts. You can find more information on wazero here.
Prerequisites
- Rust
wasm32Target: You must have thewasm32-unknown-unknowntarget installed for Rust. You can add it by running:rustup target add wasm32-unknown-unknown - Three Terminal Windows: You will need three separate terminals to run all the necessary components.
Environment Setup
To follow this guide, you need a local Arbitrum development node and Foundry's cast tool. We provide instructions for two setups: a Nix-based environment (recommended for Linux) and a manual setup for macOS.
Option 1: Nix-based Setup (Recommended for Linux)
This is the easiest way to get started if you have Nix installed.
In your first terminal, launch the Stylus development environment. This command will download all the necessary tools.
nix develop 'github:metacraft-labs/nix-blockchain-development?ref=stylus-tools#stylus'
Once inside the new shell, start the local Arbitrum node:
run-nitro-devnode
You should see it producing blocks. Keep this terminal running.
For sending transactions in Step 2, you will also use this Nix shell in your third terminal to get access to the cast command-line tool.
Option 2: Manual Setup (macOS)
If you are on macOS or do not use Nix, follow these steps.
1. Install Foundry
Install foundryup by following the instructions at https://getfoundry.sh. This will provide the cast command-line tool.
2. Install Stylus
Run the following command to install the Stylus CLI:
cargo install cargo-stylus
important
Make sure cargo is from a rustup installation, not from Homebrew. If you installed Rust via Homebrew, this step might fail.
3. Run the Local Devnode
In your first terminal, clone and run the nitro-devnode:
git clone https://github.com/OffchainLabs/nitro-devnode.git
cd nitro-devnode
./run-dev-node.sh
You should see it producing blocks. Keep this terminal running.
Step 1: Deploy the Demo Contract
This step is the same for both setups.
In your second terminal, navigate to the directory of the example program and use CodeTracer to deploy the smart contract. The ct arb deploy command handles this for you.
# Navigate to the example contract
cd test-programs/stylus_fund_tracker

# Deploy it to the local devnode
ct arb deploy
After a moment, CodeTracer will print the deployed smart contract address. Copy this address, as you will need it in the next step.
Step 2: Send Transactions
In your third terminal, you will use the cast tool to send transactions.
- Nix users: Enter the Stylus development shell first:
nix develop 'github:metacraft-labs/nix-blockchain-development?ref=stylus-tools#stylus' - macOS users: The
castcommand should be available in your PATH if you installed Foundry correctly.
Next, set up some environment variables to make the commands easier to read. Paste the contract address you copied from the previous step.
# The private key for the pre-funded devnet account
export PK=0xb6b15c8cb491557369f3c7d2c287b053eb229daa9c22138887752191c9520659

# The RPC URL for the local devnode
export RPC_URL=http://localhost:8547

# The address of your deployed contract
export CONTRACT_ADDR="<paste-your-contract-address-here>"
Now you can use cast send to call functions on your contract. These transactions will be automatically recorded by CodeTracer.
Let's send a few funding transactions and then trigger a custom event:
# Fund with 9
cast send --rpc-url "$RPC_URL" --private-key "$PK" "$CONTRACT_ADDR" "fund(uint256)" 9

# Fund with 6
cast send --rpc-url "$RPC_URL" --private-key "$PK" "$CONTRACT_ADDR" "fund(uint256)" 6

# Fund with 11
cast send --rpc-url "$RPC_URL" --private-key "$PK" "$CONTRACT_ADDR" "fund(uint256)" 11

# Trigger the largeIncomes function
cast send --rpc-url "$RPC_URL" --private-key "$PK" "$CONTRACT_ADDR" "largeIncomes(uint256)" 7
Step 3: Explore the Recorded Traces
Go back to your second terminal (where you ran ct arb deploy). Now, run the CodeTracer explorer:
ct arb explorer
A window will open displaying the recent transactions. Select any transaction to view its full execution trace in CodeTracer.
WASM
The implementation is based on a wazero WASM interpreter patch and can be used for various WASM languages. Testing has been done using Sylus contracts and small rust-based WASM programs.
Steps to record / replay a WASM program
Adjust the steps below for your use case or run the exact steps to launch the demo program which is included with the repo.
-
Make sure you have a rust WASM toolchain For example you can use the wasm32-wasip1 target, which we will use for the remainder of the guide
- Navigate to your WASM project directory.
Example:
cd codeTracer/examples/wasm_sample_atomic- Compile the rust source code to WASM
Example:
rustc --target=wasm32-wasip1 ./sample_atomic.rs -g- Use
ct record <path to .wasm file> [<args>]andct replay <name of .wasm file>(or directlyct run <path to .wasm file> [<args>])
Example:
ct run sample_atomic.wasm
Ruby
We currently have partial support for the Ruby programming language
The recorder for Ruby is currently hosted in the codetracer-ruby-recorder repo.
How to launch a program written in Ruby
Adjust the steps below for your use case or run the exact steps to launch the space_ship program which is included with the repo.
-
Navigate to CodeTracer's folder
-
Use
ct record <path to rb file> [<args>]andct replay <name of rb file>(or directlyct run <path to rb file> [<args>])Example:
ct run examples/ruby_space_ship/main.rb
caution
Recording ruby on macOS requires you to install ruby through homebrew, otherwise trying to record ruby programs will fail due to the built-in ruby binary on macOS being more than 7 years old.
Once homebrew is installed, simply install ruby with user $ brew install ruby.
Note: Ruby on rails programs are currently not supported.
Python
This guide explains how to install the Python recorder wheel, capture a trace with your own interpreter, and open the resulting recording in CodeTracer.
1. Install codetracer_python_recorder
-
Activate the environment that you normally use to run your Python code (virtualenv,
uv, Conda, system Python, etc.).ct recordalways reuses whichever interpreter is active in your shell. -
Install (or upgrade) the recorder package:
python -m pip install --upgrade codetracer_python_recorderIf you use a tool like
uvorpipx, run the equivalent command inside that tool so the recorder ends up on the samesys.pathas your application. -
Optional: confirm the module is reachable by asking the interpreter for help.
python -m codetracer_python_recorder --help
caution
If ct record cannot import codetracer_python_recorder, recording will fail with a module import error. Install the package in the interpreter you intend to trace or point Codetracer at a specific interpreter via CODETRACER_PYTHON_INTERPRETER=/path/to/python.
2. Record a trace
-
From the same shell where the interpreter (and recorder wheel) are available, run:
ct record path/to/script.py [-- <script arguments>]- Omit
--lang; Python scripts are auto-detected. - Any arguments after
--are passed directly to your script. - Use
CODETRACER_PYTHON_INTERPRETERif you need to force a specific interpreter (for example, inside CI).
- Omit
-
The command prints the trace identifier and the output directory (defaults to
., configurable with-o). The directory containstrace.json,trace_paths.json, andtrace_metadata.jsongenerated by the Python recorder via the db backend.
3. Open the trace
You can explore the recording immediately in the UI or later on:
-
Launch the GUI with the most recent trace:
ct replay -
Replay a specific Python trace by path:
ct replay --trace-folder path/to/trace-output -
Or jump straight from recording to replay in one command:
ct run path/to/script.py [-- <script arguments>]
All three commands reuse the recorded artefacts created by codetracer_python_recorder, so you see the exact execution captured during ct record.
Overview
Welcome to the CodeTracer Usage Guide. This guide will help you understand how to use CodeTracer effectively to debug your applications.
Core Concept: Record and Replay
Unlike traditional debuggers that attach to a running process, CodeTracer works by first recording your application's execution into a trace file. This trace captures everything that happens during the run.
Once a recording is made, you can replay it as many times as you need in the CodeTracer GUI. This allows you to inspect the application's state at any point in time, move forwards and backwards through the execution, and use powerful features like tracepoints without having to run your application again.
Think of it like recording a video of your program's execution that you can then analyze in detail.
How to Use This Guide
This guide is structured to help you get started quickly and then dive deeper into the features that interest you.
- To learn about the different ways to interact with CodeTracer, see the following sections:
- Graphical User Interface (GUI): Learn how to use the visual interface to replay traces, inspect state, and set tracepoints.
- Command-Line Interface (CLI): Discover how to record traces and manage trace files from your terminal.
- To learn about specific features, see these sections:
- Tracepoints: A deep dive into using tracepoints for advanced debugging scenarios.
- For advanced use cases, explore these topics:
- CodeTracer Shell: For integrating CodeTracer with complex or custom build systems.
Command-line interface
This page details some of the options, available to you through the ct CLI command.
Usage
When you launch the CodeTracer GUI, it will offer you the option to also install the CodeTracer CLI. It provides convenient ways to create and load trace files from the command-line or to integrate CodeTracer with CI processes.
Run ct --help to see the full list of supported subcommands, but the most commonly used ones are the following:
<application> can be a source file or a project folder (depending on the language):
ct run <application>- Creates a recording and load it in CodeTracer with a single command.ct record <application>- Creates a trace file that can be loaded later or shared.ct replay- Launches the CodeTracer GUI with a previously recorded trace file. Common usages are:ct replay- Opens a simple console-based dialog to choose what recording you want to replay.ct replay <program-name>- Opens the last trace of an application.ct replay --id=<trace-id>- Opens a trace by its trace id.ct replay --trace-folder=<trace-folder>- Opens a trace by its trace folder.
ct- Launches the startup screen of the CodeTracer GUI.ct help/ct --help- Gives you a help message.ct version/ct --version- Returns the current version of CodeTracer.
Unlike other debuggers, where the debugger is attached to your application process, here you have to launch your application
through the CodeTracer CLI with commands like ct run or ct record(or through the user interface, which is documented in the next chapter).
Think of debugging your application with CodeTracer as recording a video and then replaying it in order to find
the information you need. This is why we use commands like record and replay.
Graphical User Interface (GUI)
The CodeTracer GUI is the primary tool for replaying and analyzing trace files. It provides a rich, interactive environment to inspect every detail of your program's execution.
You can launch the GUI in a few ways:
- Run
ctin your terminal to open the Startup Screen. - Run
ct replayreturns a list of recorded traces. Enter the number of a trace to open it in CodeTracer's UI. - Run
ct run <application>to record a new trace and immediately open it for replay.
Note: For some programming languages it is required to provide the path to a source file that contains the entry point, for other languages the path to the project folder is sufficient. Example:
ct run examples/ruby_space_ship/main.rb
ct run examples/noir_space_ship
Startup Screen
If you start CodeTracer by just running the ct command you will see the startup screen.
From here, you can:
- View and open recent traces: The main list shows traces you have recently recorded or opened. You can click on any trace to open it in the Replay Interface.
- Open a local trace: Click the "Open local trace" button to open a trace file from your computer. This is useful for opening traces that are not in your recent list or for opening traces shared by others.
- Record a new trace: The "Record new trace" button allows you to start a new recording session. This is currently supported for Noir projects. You will be prompted to select the root folder of your Noir project, and CodeTracer will handle the rest. Once the recording is complete, the new trace will open automatically.
Replay Interface
The Replay Interface is where you will spend most of your time analyzing traces. It is composed of several panels, each providing a different view into your program's state.
Watch this video for a demonstration of the key features:
Here is a brief overview of the main components:
- Source Code Panel: Displays your source code, highlighting the currently executing line. Thanks to a feature called "Omniscience", taken code branches are also highlighted while non-executed code is grayed out. This allows you to see the future and the past: you can click on any line to see the program's state and the values of all variables at that point in time. You can also right-click to add tracepoints.
- Filesystem Panel: Provides a tree-like view of the project's source code, allowing you to browse and open files.
- Calltrace Panel: Shows the entire execution trace as a hierarchical list of function calls. You can navigate through the program's execution by jumping to any point in the call trace.
- State Panel: Displays the state of all local variables at the currently selected point in the execution. As you navigate through the code, this panel updates to reflect the variables that are accessible from the current line of code as well as their exact values. The state panel also gives quick access to a variable's value history.
- Scratchpad Panel: Allows you to "set aside" a specific variable or object at its current state and conveniently browse through object properties or big values.
- Event Log: A log of all significant events that occurred during the execution like stdout and strerr streams, read events, write events, network events, trace events, file operations, errors and evm events.
- Terminal Output Panel: Shows the complete terminal output (stdout/stderr) of the traced program. Clicking on any part of the terminal output will result in a jump to the exact moment when the character has been printed.
All the components are designed to let you move freely through your program's execution, making it easy to pinpoint the cause of bugs or understand complex behavior.
What are tracepoints?
Tracepoints are a type of breakpoint that allows you to run arbitrary code every time this breakpoint is hit. In most debuggers that support tracepoints they allow for efficient debugging of complex scenarios, like really deep recursion, or complex control flow.
In CodeTracer, however, they can also unlock a number of strategies for additional debugging, specifically in the realm of hotspot debugging.
Tracepoints usage guide
From the GUI:
- Right-click on a line
- Click on "Add tracepoint"
- The tracepoints popup should appear
- Write your tracepoint code in the text editor in the tracepoints popup
- Press "CTRL + Enter" to run the trace
- After running the trace, the output of your tracepoint will be listed in the tracepoint popup, and in the event log
From the TUI: Coming soon!
From the REPL: Coming soon!
Tracepoints language
Syntax
The syntax of the language is similar to Noir/Rust (and therefore most C-like languages). However it doesn't use semicolons.
In the future it is possible to add language-specific features or dialects of the tracepoint language.
Literals
Integer (1, 23, 12), Float (1.23, .234, 123.), Bool (true, false) and String ("some text") literals
are supported.
log()
The log() statement is used to evaluate the argument expression and add it as output from the current tracepoint.
The log() statement suppors multiple values that are comma-separated: log(v1, v2, v3).
Example
fn test() {
  let mut sum = 0;

  for i in 0..3 {
    sum += i;
    --------------------------------------------------------------------------------
    |  log("I'm in the loop", i)
    |
    --------------------------------------------------------------------------------
    // Output:
    --------------------------------------------------------------------------------
    |  "I'm in the loop" i=0
    |  "I'm in the loop" i=1
    |  "I'm in the loop" i=2
    --------------------------------------------------------------------------------
  }
Accessing variables
The tracepoint for has access to all the variables, that are defined when the line on which the tracepoint is added is evaluated. You can reference them just by using their names in the expressions.
Example
fn add(a: i32, b: i32) -> i32 {
  a + b
  --------------------------------------------------------------------------------
  |  log(a)
  |  log(b)
  --------------------------------------------------------------------------------
  // Output:
  --------------------------------------------------------------------------------
  |  a=3 b=5
  --------------------------------------------------------------------------------
}
Comparison
== and !=
Two values are considered eqial iff their types are the same and their values are the same. Exception to this rule is comparing Int and Float, which are compared by their values, despite them being different type.
<, >, <=, >=
These operators work only with numerical values (e.g Int and Float). If at least one of the values is of non-numerical type, then an Error is raised.
Example
| Expression | Value |
|---|---|
| 1 == 1 | true |
| 1 != 1 | false |
| 1 == 2 | false |
| 1 != 2 | true |
| "banana" == "banana" | true |
| "banana" != "banana" | false |
| "banana" == "apple" | false |
| "banana" != "apple" | true |
| "banana" == 1 | false |
| "banana" != 1 | true |
| 1.0 == 1 | true |
| 1.0 != 1 | false |
| 2.0 == 1 | false |
| 2.0 != 1 | true |
| "1" == 1 | false |
| "1" != 1 | true |
| 1 < 2 | true |
| 1 <= 2 | true |
| 1 > 2 | false |
| 1 >= 2 | false |
| 1 < 2.2 | true |
| 1.1 <= 2 | true |
| 1 > 2.2 | false |
| 1.1 >= 2 | false |
| 1 < "2" | ERROR |
| "0" < 1 | ERROR |
| "1" >= "2" | ERROR |
Arithmetic operations
The supported arithmetic operations are addition (+), subtraction (-), multiplication (*), division (/) and
remainder (%). They work only with numerical types (Int and Float).
When both arguments are Integer values, then the result is an Integer (for / the result is rounded toward 0). If at
least one of the arguments is a Float, then the result is a Float.
Example
| Expression | Value |
|---|---|
| 2 + 3 | 5 |
| 2 + 3.0 | 5.0 |
| 2.2 + 3.3 | 5.5 |
| 2 - 3 | -1 |
| 2 - 3.0 | -1.0 |
| 2.2 - 3.3 | -1.1 |
| 2 * 3 | 6 |
| 2 * 3.0 | 6.0 |
| 2.2 * 3.3 | 7.26 |
| 7 / 3 | 2 |
| 7 / 3.0 | 2.3333333 |
| 7.7 / 3.3 | 2.3333333 |
| 7 % 3 | 1 |
| 7 % 3.0 | 1.0 |
| 7.7 % 3.3 | 1.1 |
Conditional branching (if-else)
The tracepoint language also supports conditional evaluation and branching. If the condition expression doesn't evaluate to a boolean value, then an error is raised.
Example
fn test() {
  let mut sum = 0;

  for i in 0..4 {
    sum += i;
    --------------------------------------------------------------------------------
    |  log(i)
    |  if i % 2 == 0 {
    |    log("even")
    |  } else if i % 3 == 0 {
    |    log("div 3")
    |  } else {
    |    log("odd")
    |  }
    --------------------------------------------------------------------------------
    // Output:
    --------------------------------------------------------------------------------
    |  i=0 even
    |  i=1 odd
    |  i=2 even
    |  i=3 div 3
    --------------------------------------------------------------------------------
  }
}
Array indexing
If a value is an array, you can index it using the [] operators. Indices are 0-based.
Example
fn arr(a: i32, b: i32) -> i32 {
  let a = [1, 2, 3, 4, 5];
  let b = a[2];
  --------------------------------------------------------------------------------
  |  log(a)
  |  log(a[0])
  |  log(a[1])
  |  log(a[4])
  --------------------------------------------------------------------------------
  // Output:
  --------------------------------------------------------------------------------
  |  a=[1, 2, 3, 4, 5] a[0]=1 a[1]=2 a[4]=5
  --------------------------------------------------------------------------------
}
Errors
When an error occurs, the evaluation of the tracepoint stops.
Example
fn arr(a: i32, b: i32) -> i32 {
  let a = [1, 2, 3, 4, 5];
  let b = a[2];
  --------------------------------------------------------------------------------
  |  log(a[0])
  |  if a[1] { // This will cause error
  |    log("banana")
  |  }
  |  log(a[2]) // This won't be evaluated
  --------------------------------------------------------------------------------
  // Output:
  --------------------------------------------------------------------------------
  |  a[0]=1 Error=Non-boolean value on conditional jump
  --------------------------------------------------------------------------------
}
Rust-specific extensions
We have some language-specific extensions in mind, but nothing concrete yet.
Codetracer Shell
note
This feature is in its infancy, but in development. The API, implementation approach and feature set/goals may be subject to change!
It's not a part of the public CodeTracer feature set or source code for now.
CodeTracer Shell is a special feature of CodeTracer that creates an environment, and optionally an interactive shell, that can be used to build applications with complex, or unorthodox build systems.
CodeTracer requires some additional compile flags and instrumentation functions to be built with your application. Because of this, CodeTracer only supports building from a single file. Support for multi-file projects using build systems is instead relegated to CodeTracer Shell.
When you execute commands in the CodeTracer Shell's interactive shell, or environment, CodeTracer Shell inserts itself into the subprocesses that are launched during the build process of your application, making building and running applications with more complex build systems easier.
For example, let's say you want to compile a C/C++ application using CMake. With CodeTracer Shell you can do either:
user $ ct shell
(ct shell) user $ mkdir build && cd build
(ct shell) user $ cmake ..
(ct shell) user $ make
using the interactive shell, or the following using commands:
user $ ct shell -- bash -c "mkdir build && cd build && cmake .. && make"
Build systems
Codetracer uses nix, just, tup and direnv as parts of its build system.
Breakdown of the different components
Nix
The Nix package manager/build system deals with managing all dependencies, required by CodeTracer, as well as packaging
it for NixOS. It can package for other operating systems through an AppImage generator utility, however currently we are building our
appimages with custom shell scripts in appimage-scripts.
Just
The just task runner is used to trigger build commands and various other actions. It's semi-analogous to a Makefile. The following commands are the most widely-used:
just build- Builds the project with Tup and starts the automatic build process, which is used for active developmentjust build-once- Just builds the project using Tupjust build-nix- Builds the project and packages it for Nixjust build-docs- Builds the documentation. More info can be found herejust cachix-push-nix-package- Pushes nix package artefacts to cachixjust cachix-push-devshell- Pushes the current dev shell to cachixjust reset-db- Resets the local user's trace databasejust clear-local-traces- Clears the local user's tracesjust reset-layout- Resets the GUI window arrangements layout if your user's layout is incompatible with the latest version of CodeTracer. Further documentationjust reset-config- Resets the user's configuration if it's incompatible with the latest version of CodeTracer. Further documentation
Tup
The Tup build system is used for local builds of CodeTracer and deals with calling the actual low-level build instructions.
Direnv
The direnv utility sets up your local environment for using CodeTracer.
Packaging
More detailed breakdown of the Nix package
Coming soon!
Packaging for non-NixOS distributions
tip
If you're a user that wants a package for your distribution contact us. We're currently in the process of creating packages for popular distributions, such as Debian/Ubuntu, Fedora/RHEL, Arch Linux, Gentoo, Void, etc.
To package for another Linux distribution with a ports-based package manager, you can utilise our AppImage(currently unreleased),
which you can install to /usr/bin. Along with it, you should also install our icon and desktop file
from resources/ to the needed directories, such as /usr/share/pixmaps and /usr/share/applications.
Packaging for Windows(DB-backend only)
Coming soon!
Packaging for macOS(DB-backend only)
Coming soon!
Contributing
We welcome contributors!
If you want to fix something smaller, feel free to open an issue or a a PR.
For bigger changes it's advised to first open an issue/discussion in the relevant Github repo or to discuss it our team in our Discord chat server.
Contributors guide
Here are some recommendations, however if you want more info, our docs/contributor guide are hosted on the CodeTracer site !
The guide is written as a set of markdown documents and built using mdbook and mdbook-alerts .
You can contribute to the documentation itself, by editing it in docs/book and making a pull request. You can iterate on it locally , by cloning the repo, activating it's nix devshell and running just serve-docs [hostname port]: it will serve it locally(by default on http://localhost:3000).
Style guide
For Rust, we are using cargo fmt to autoformat our code, and cargo clippy with some custom allow/deny rules inside the code.
We have a cargo clippy check in our CI, but one can also run it locally.
For Nim, we still haven't written down a guide or list of rules and principles that we agree on, so this is something that we hope to do. We might also link to an existing document.
Commits/Pull Requests
We are using the "Conventional Commits" strategy.
We use or are ok with using more "types", not only those included by default in their official page: e.g. cleanup:, tooling:, examples: etc.
We use git rebase, not merge and currently use the github pull requests as the main way to add code. Any pull request would need at least one review
from someone from the CodeTracer team.
Troubleshooting
CodeTracer is currently in an experimental state, so we expect that there are many bugs that have not been found as of now. If you find any bug, please report it as an issue on GitHub.
In the meantime, you can use this page to fix some issues that are somewhat common.
Fixing outdated configuration/layout files
You can reset them by deleting your ~/.config/codetracer folder currently.
You will be able to find more information in the configuration docs eventually: work in progress.
Resetting the local trace database
There are 2 commands that can be used to completely wipe all traces from your user's data:
just reset-db- Resets the local user's trace databasejust clear-local-traces- Clears the local user's traces
Broken local build
Sometimes your local build might break. In most cases, a simple direnv reload and just build should be able to fix it.
Otherwise, you can ask for help on our issues tracker, or in our chat server
Environment variables
CodeTracer exposes a number of environment variables that you can use to override some of its behaviours:
for many of the flags, we expect "1" to enable them
CODETRACER_ELECTRON_ARGS- adds arguments for launching Electron. Useful for debugging production buildsCODETRACER_WRAPPER_PID- overrides the process ID of thectCodeTracer wrapperCODETRACER_CALLTRACE_MODE- changes the calltrace modeCODETRACER_RECORD_CORE- this does nothing as it is only related to the unreleased system backendCODETRACER_SHELL_SOCKET- this sets the socket path for sending events to the CI integration fromct record(or eventuallyct shell)CODETRACER_SHELL_ADDRESS- this sets the address for sending events to the CI integration fromct record(or eventuallyct shell)CODETRACER_SHELL_EXPORT- this enables export mode forct recordon: exporting the traces into zip files in the folder that is the value of this env variables; (similarly to thect record -e=<zippath>option, but for all records while the variable is enabled). The trace archives try to use a globally unique id in their filenames, fromstd/oidsin the nim stdlib: https://nim-lang.org/docs/oids.htmlCODETRACER_DEBUG_CURL- if "1", print debug output for the raw objects sent with curl for the CI integration fromct record(or eventuallyct shell)CODETRACER_DEBUG_CT_REMOTE- if "1", print debug output(for now process command name and arguments) for the trace sharing code and commands that callct-remote(desktopclient), e.g.ct upload,ct download,ct login,ct set-default-orgCODETRACER_RR_SOFT_MODE- if we are using therr.softpatch in therrused byct: if "1", runsrr recordandrr replaywith-Wflag ofrr.soft: software counters/dynamic instrumentation. rr.soft is https://github.com/sidkshatriya/rr.softCODETRACER_RECORD_BACKEND- this is a newer version ofCODETRACER_RECORD_CORE: if set, and ifctis in PATH, lets you record the internal db-backend process when doingct replay
e.g.env CODETRACER_RECORD_BACKEND=1 ct replay db-trace
there might be problem if you try to replay a rr trace and record that:
it seems it might work, but i thinkrr under rrmight be still problematic
CodeTracer Shell
These are generally not functional right now, since they affect CodeTracer Shell, which is currently not stable/in very prototypical state:
CODETRACER_SHELL_BASH_LOG_FILE- overrides the log fileCODETRACER_SHELL_ID- overrides the shell IDCODETRACER_SESSION_ID- overrides the CodeTracer Shell session ID so that the current commands affect a previous shell sessionCODETRACER_SHELL_REPORT_FILE- overrides the report file of CodeTracer ShellCODETRACER_SHELL_USE_SCRIPT- ?CODETRACER_SHELL_RECORDS_OUTPUT- ?CODETRACER_SHELL_CLEANUP_OUTPUT_FOLDER- ?
Building the documentation
The documenation for codetracer is written in Markdown using mdbook. We use some extensions from GitHub Flavoured Markdown : specifically alert boxes with mdbook-alerts.
To build the documentation run just build-docs. If you want to iterate on the documentation for local development, run just serve-docs [<hostname>] [<port>] or by going in the docs directory and running mdbook serve [--hostname <hostname>] [--port <port>] and a web server will be started, by default on http://localhost:3000 .
The built doc files are stored under docs/experimental-documentation/build, while the markdown files are under docs/experimental-documentation and its child directories.