Graphical User Interface (GUI)
The CodeTracer GUI is the primary tool for replaying and analyzing trace files. It provides a rich, interactive environment to inspect every detail of your program's execution.
You can launch the GUI in a few ways:
- Run
ctin your terminal to open the Startup Screen. - Run
ct replayreturns a list of recorded traces. Enter the number of a trace to open it in CodeTracer's UI. - Run
ct run <application>to record a new trace and immediately open it for replay.
Note: For some programming languages it is required to provide the path to a source file that contains the entry point, for other languages the path to the project folder is sufficient. Example:
ct run examples/ruby_space_ship/main.rb
ct run examples/noir_space_ship
Startup Screen
If you start CodeTracer by just running the ct command you will see the startup screen.
From here, you can:
- View and open recent traces: The main list shows traces you have recently recorded or opened. You can click on any trace to open it in the Replay Interface.
- Open a local trace: Click the "Open local trace" button to open a trace file from your computer. This is useful for opening traces that are not in your recent list or for opening traces shared by others.
- Record a new trace: The "Record new trace" button allows you to start a new recording session. This is currently supported for Noir projects. You will be prompted to select the root folder of your Noir project, and CodeTracer will handle the rest. Once the recording is complete, the new trace will open automatically.
Replay Interface
The Replay Interface is where you will spend most of your time analyzing traces. It is composed of several panels, each providing a different view into your program's state.
Watch this video for a demonstration of the key features:
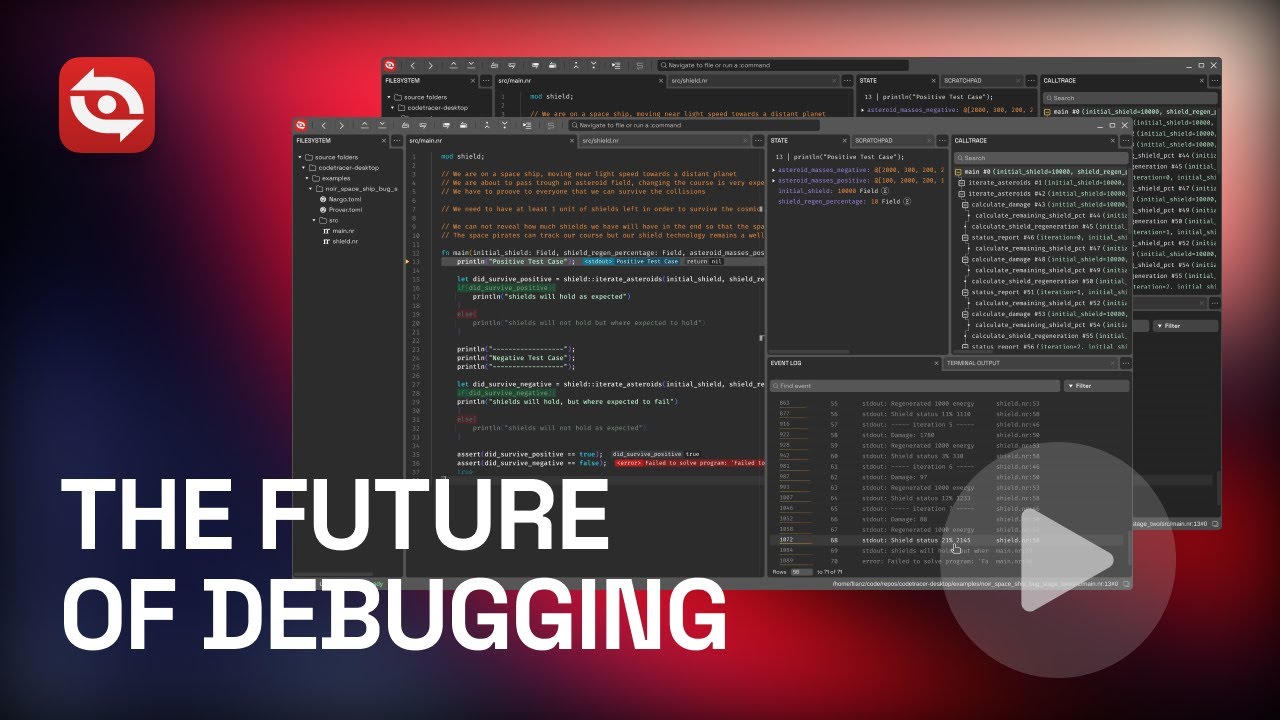
Here is a brief overview of the main components:
- Source Code Panel: Displays your source code, highlighting the currently executing line. Thanks to a feature called "Omniscience", taken code branches are also highlighted while non-executed code is grayed out. This allows you to see the future and the past: you can click on any line to see the program's state and the values of all variables at that point in time. You can also right-click to add tracepoints.
- Filesystem Panel: Provides a tree-like view of the project's source code, allowing you to browse and open files.
- Calltrace Panel: Shows the entire execution trace as a hierarchical list of function calls. You can navigate through the program's execution by jumping to any point in the call trace.
- State Panel: Displays the state of all local variables at the currently selected point in the execution. As you navigate through the code, this panel updates to reflect the variables that are accessible from the current line of code as well as their exact values. The state panel also gives quick access to a variable's value history.
- Scratchpad Panel: Allows you to "set aside" a specific variable or object at its current state and conveniently browse through object properties or big values.
- Event Log: A log of all significant events that occurred during the execution like stdout and strerr streams, read events, write events, network events, trace events, file operations, errors and evm events.
- Terminal Output Panel: Shows the complete terminal output (stdout/stderr) of the traced program. Clicking on any part of the terminal output will result in a jump to the exact moment when the character has been printed.
All the components are designed to let you move freely through your program's execution, making it easy to pinpoint the cause of bugs or understand complex behavior.